Advanced PostgreSQL monitoring using Telegraf, InfluxDB, Grafana

Introduction
This post will go through my experience with setting up some advanced monitoring for PostgreSQL database using Telegraf, InfluxDB, and Grafana (also known as the TIG stack), the problems I faced, and what I ended up doing at the end.
What do I mean by advanced? I liked this Datadog article about some key metrics for PostgreSQL monitoring. Also, this PostgreSQL monitoring template for Zabbix has some good pointers. I didn’t need everything mentioned in these links, but they acted as a good reference. I also prioritized monitoring for issues which I’ve myself faced in the past.
Some key things that I planned to monitor:
- Active (and idle) connections vs. max connections configured
- Size of databases and tables
- Read query throughput and performance (sequential vs. index scans, rows fetched vs. returned, temporary data written to disk)
- Write query throughput and performance (rows inserted/updated/deleted, locks, deadlocks, dead rows)
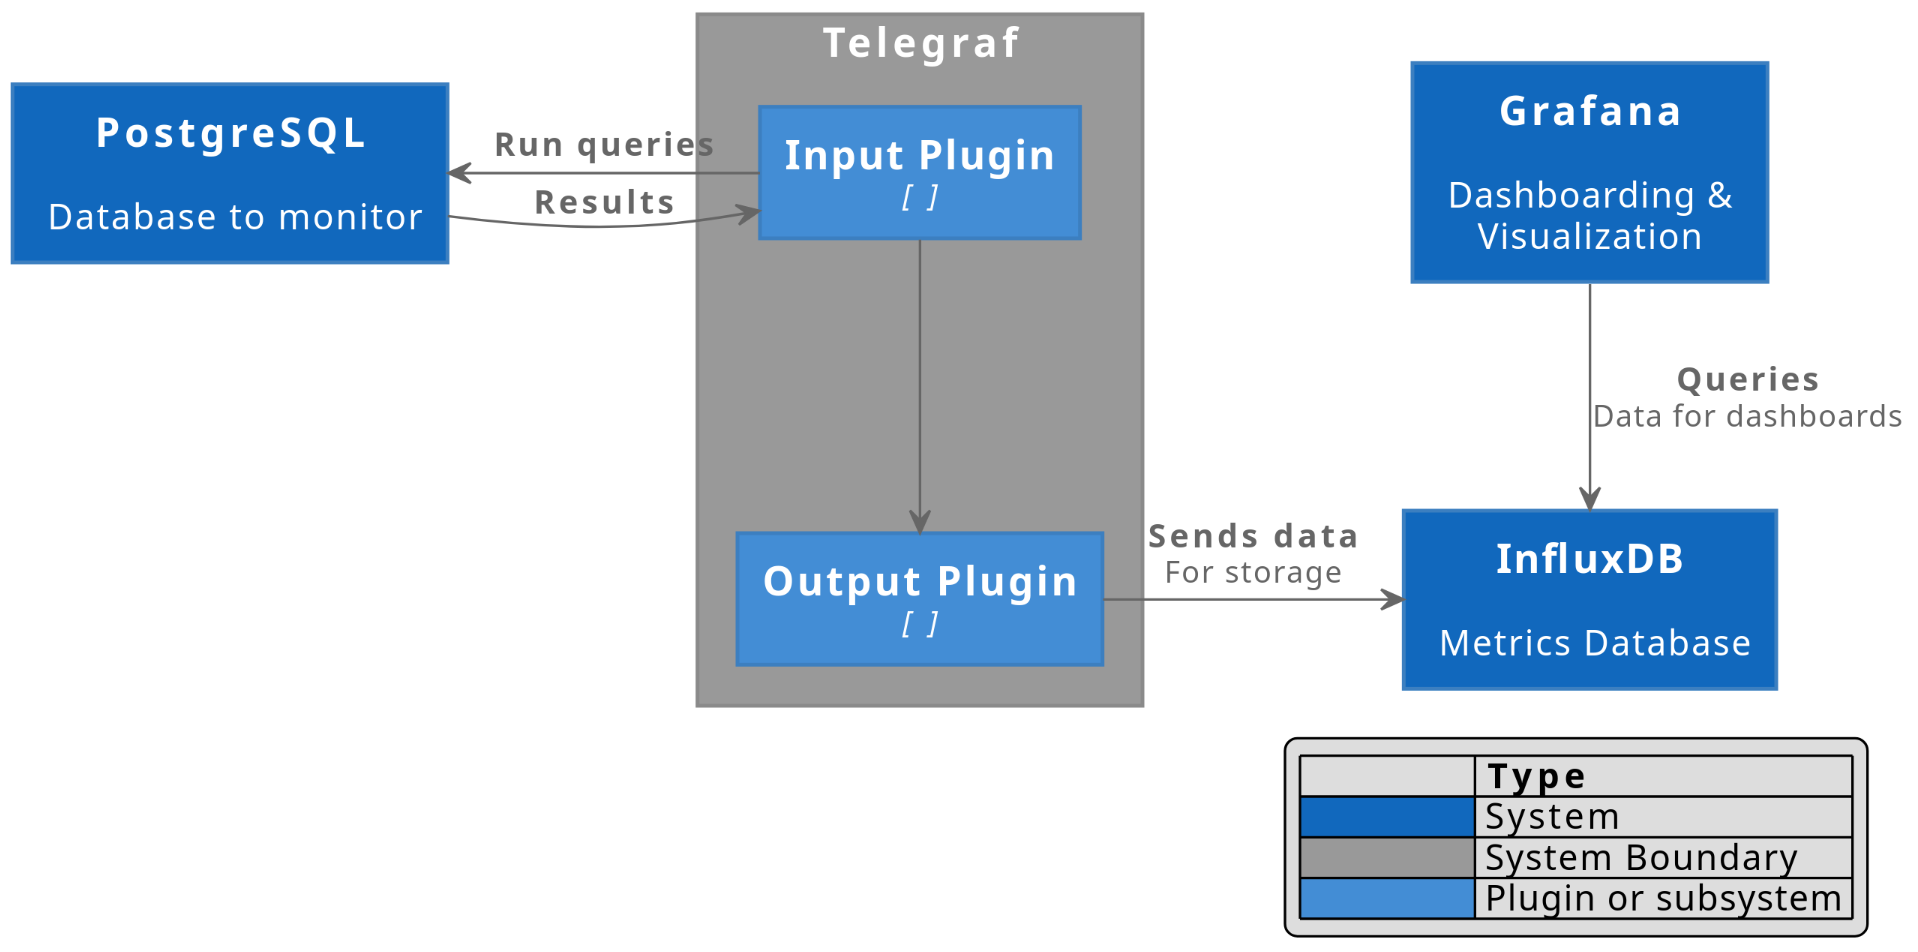
There are a lot of resources online about setting up the data collection pipeline from Telegraf to InfluxDB, and creating dashboards on Grafana. So, I’m not going into too much detail on this part. This is what the pipeline looks like:
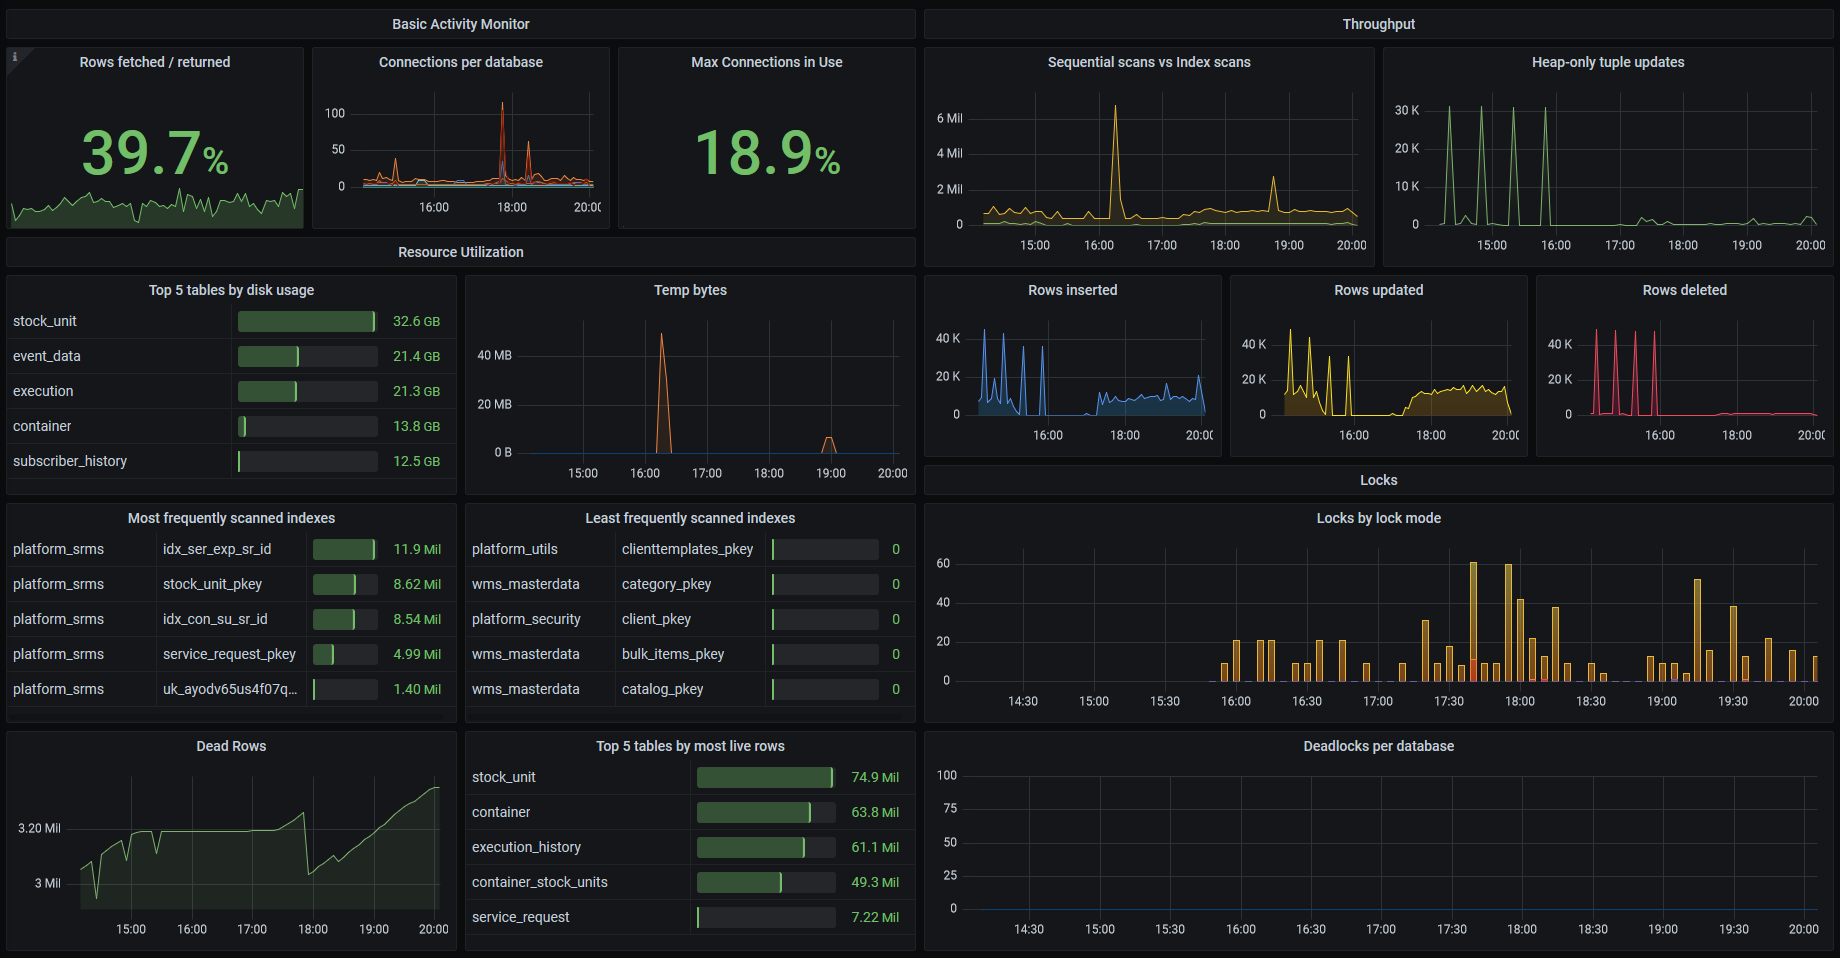
And here’s what my final Grafana dashboard looks like
Research on existing solutions
I found several solutions and articles online about monitoring PostgreSQL using Telegraf:
1. Telegraf PostgreSQL input plugin
Telegraf has a PostgreSQL input plugin which provides some built-in metrics from the pg_stat_database and pg_stat_bgwriter
views. But this plugin cannot be configured to run any custom SQL
script to gather the data that we want. And the built-in metrics are a
good starting point, but not enough. So, I rejected it.
2. Telegraf postgresql_extensible input plugin
Telegraf has another PostgreSQL input plugin called postgresql_extensible. At first glance, this looks promising: it can run any custom query, and multiple queries can be defined in its configuration file.
However, there is an open issue due to which this plugin does not run the specified query against all databases, but only against the database name specified in the connection string.
One way this can still work is to specify multiple input blocks in the Telegraf config file, one for each database.
[[inputs.postgresql_extensible]]
  address = "host=localhost user=postgres dbname=database1"
  [[inputs.postgresql_extensible.query]]
    script="db_stats.sql"

[[inputs.postgresql_extensible]]
  address = "host=localhost user=postgres dbname=database2"
  [[inputs.postgresql_extensible.query]]
    script="db_stats.sql"
But, configuring this does not scale, especially if the database names are dynamic or we don’t want to hardcode them in the config.
But I really liked the configuration method of this plugin, and I think this will work very well for my use case once the associated Telegraf issue gets resolved.
3. Using a monitoring package like pgwatch2
Another method I found was to use a package like pgwatch2. This is a self-contained solution for PostgreSQL monitoring and includes dashboards as well.
Its main components are
- A metrics collector service. This can either be run centrally and “pull” metrics from one or more PostgreSQL instances, or alongside each PostgreSQL instance (like a sidecar) and “push” metrics to a metrics storage backend.
- Metrics storage backend. pgwatch2 supports multiple metrics storage backends like bare PostgreSQL, TimescaleDB, InfluxDB, Prometheus, and Graphite.
- Grafana dashboards
- A configuration layer and associated UI to configure all of the above.
I really liked this tool as well, but felt like this might be too complex for my needs. For example, it monitors a lot more than what I want to monitor, and it has some complexity to handle multiple PostgreSQL versions and multiple deployment configurations.
But I will definitely keep this in mind for a more “batteries included” approach to PostgreSQL monitoring for future projects.
My solution: custom Telegraf plugin
Telegraf supports writing an external custom plugin, and running it via the execd plugin. The execd plugin runs an external program as a long-running daemon.
This approach enabled me to build the exact features I wanted, while also keeping things simple enough to someday revert to using the Telegraf built-in plugin for PostgreSQL.
The custom plugin code can be found at this Github repo. Note that I’ve also included the line_protocol.py file from influx python sdk so that I would not have to install the whole sdk just for line protocol encoding.
What this plugin (and included configuration) does:
- Runs as a daemon using Telegraf execd plugin.
- When Telegraf asks for data (by sending a newline on STDIN), it runs the queries defined in the plugin’s config file (against the configured databases), converts the results into Influx line format, and sends it to Telegraf.
- Queries can be defined to run either on a single database, or on all databases that the configured pg user has access to.
This plugin solves the issue with Telegraf’s postgresql_extensible plugin for me—I don’t need to manually define the list of databases to be able to run queries against all of them.
This is what the custom plugin configuration looks like
[postgresql_custom]
address=""

[[postgresql_custom.query]]
sqlquery="select pg_database_size(current_database()) as size_b;"
per_db=true
measurement="pg_db_size"

[[postgresql_custom.query]]
script="queries/backends.sql"
per_db=true
measurement="pg_backends"

[[postgresql_custom.query]]
script="queries/db_stats.sql"
per_db=true
measurement="pg_db_stats"

[[postgresql_custom.query]]
script="queries/table_stats.sql"
per_db=true
tagvalue="table_name,schema"
measurement="pg_table_stats"
Any queries defined with per_db=true will be run against all databases. Queries can be specified either inline, or using a separate file.
The repository for this plugin has the exact queries configured above. It also has the Grafana dashboard JSON which can be imported to get the same dashboard as above.
Future optimizations
- Monitoring related to replication is not added yet, but can be added easily
- No need to use superuser account in PostgreSQL 10+
- This does not support running different queries depending on version of the target PostgreSQL system.
Let me know in the comments below if you have any doubts or suggestions to make this better.
Responses · 1
Great information, I have already put it to good use. But I have a slightly unrelated question. In the image of you Grafana Dashboard, you have some really great panels that I haven't been able to reduplicate. Namely the top 5, most freq., & least freq panels. I run into issues where I can get my results sorted, not to have that table like view with the gauges. I have tried to monkey with the bar gauges, but no success. best I can get is an unsorted list so I can't make a top, most, or least of anything. I am on Grafana 7.3.
Thanks William.
The github repo mentioned above also has an exported JSON of the grafana dashboard I'm using: https://github.com/srijan/telegraf-execd-pg-custom/blob/main/PostgreSQL%20Overview-1615476473641.json
Awesome, thank you very much!!